
Telemetry logs via AppInsights Logs
In my previous blog post I experimented with 9 use cases involving 4 BC application extensions. I performed new installations, updates and un-installations.
Two weeks later I tried to recall the details of my experiments but needless to say, I only recalled a few vague details.
Luckily, the logs were still recorded within Azure Application Insights service from the day I installed the extensions, therefore it was not too difficult to scan traces table and hopefully found some of the details.
Log into your Azure portal, locate the AppInsights service and open Logs. You can consult the queries run in the past as they are available for re-run in Queries History section:
By adjusting the time stamp filtering I could see what was performed.

But there is an even nicer tool for telemetry logs analysis.
Dynamics 365 Business Central Usage Analytics
This app can be installed in Power BI. More details on how to install the app can be found on this Microsoft page.
To install it, log in Power BI, and open Apps blade. From there click on Get Apps:

Then search for “Business Central Usage” and install the app. Good news, there is a new version of the app, so if you have already installed an older version, to take advantage of the latest changes is best time to install the latest version of the app:

Once installed, click on the link in Apps and launch it.
First, connect app to your data in Application Insights.
Initially, the app will show you some sample data. To capture analytics about your sandbox or environment, click on Connect your data.


After connecting to your App Insights data you can see all reports populated.
For example, one can find the Extensions Changes under Administration:

The app exposes telemetry logs details through 4 reports:
- usage
- errors
- performance
- administration.
Each area has a last page named “About the report”.
Click on it to see details about the report coverage and documentation url as well as a sample kusto query.

Example 1: Extension Changes
For Extension changes the sample Kusto query is located BCTech/ExtensionLifecycle.kql at master · microsoft/BCTech · GitHub.
// Environment app update succeeded
traces
| where timestamp > ago(30d) // adjust as needed
| where customDimensions.eventId == 'LC0170'
| project timestamp
, message
, aadTenantId = customDimensions.aadTenantId
, allowDependencyUpdate = customDimensions.allowDependencyUpdate
, allowPreviewVersion = customDimensions.allowPreviewVersion
, applicationFamily = customDimensions.applicationFamily
, countryCode = customDimensions.countryCode
, environmentName = customDimensions.environmentName
, environmentType = customDimensions.environmentType
, extensionId = customDimensions.extensionId
, extensionName = customDimensions.extensionName
, extensionPublisher = customDimensions.extensionPublisher
, extensionScope = customDimensions.extensionScope
, extensionSourceVersion = customDimensions.extensionSourceVersion
, extensionDestinationVersion = customDimensions.extensionDestinationVersion
, useEnvironmentUpdateWindow = customDimensions.useEnvironmentUpdateWindow
, runAfterDateUtc = customDimensions.runAfterDateUtc
, totalTime = customDimensions.totalTime
Business Central Usage is a template app. You can open the app in edit mode and customize it to resolve your own requirements.

Example 2: Location, Location, Location
Wouldn’t be cool to see where are the users are logging in Business Central?
Yes, it would be. Well, Application Insights receives information emitted by BC about the location:

In my sandbox, I was the only one logged on, and I was behind a VPN so location is not accurate.
But, in most cases, it will be accurate and perhaps useful to know in some cases.
There is also a KQL query you can play with in App Insights:
pageViews
| where timestamp > ago(7d)
| extend
aadTenantId = customDimensions.aadTenantId
, alObjectId = customDimensions.alObjectId
, alObjectName = customDimensions.alObjectName
, alObjectType = customDimensions.alObjectType
, clientType = customDimensions.clientType
, companyName = customDimensions.companyName
, component = customDimensions.component
, componentVersion = customDimensions.componentVersion
, deprecatedKeys = customDimensions.deprecatedKeys
, designerLevel = customDimensions.designerLevel
, deviceLocale = customDimensions.deviceLocale
, deviceScreenResolution = customDimensions.deviceScreenResolution
, environmentName = customDimensions.environmentName
, environmentType = customDimensions.environmentType
, eventId = customDimensions.eventID // note that this is different from other signal
, expandedFastTabs = customDimensions.expandedFastTabs
, factboxExpanded = customDimensions.factboxExpanded
, hostType = customDimensions.hostType
, message = customDimensions.message
, pageIsModal = customDimensions.pageIsModal
, pageMode = customDimensions.pageMode
, pageType = customDimensions.pageType
, refUri = customDimensions.refUri
// all of this data is not stored in customDimensions
, location = client_CountryOrRegion
, durationInMs = duration
, clientBrowser = client_Browser
, clientOS = client_OS

Example 3: Incoming or Outgoing web service errors
Any call with a http response status not equal to 200 is an indication of a web service failure:
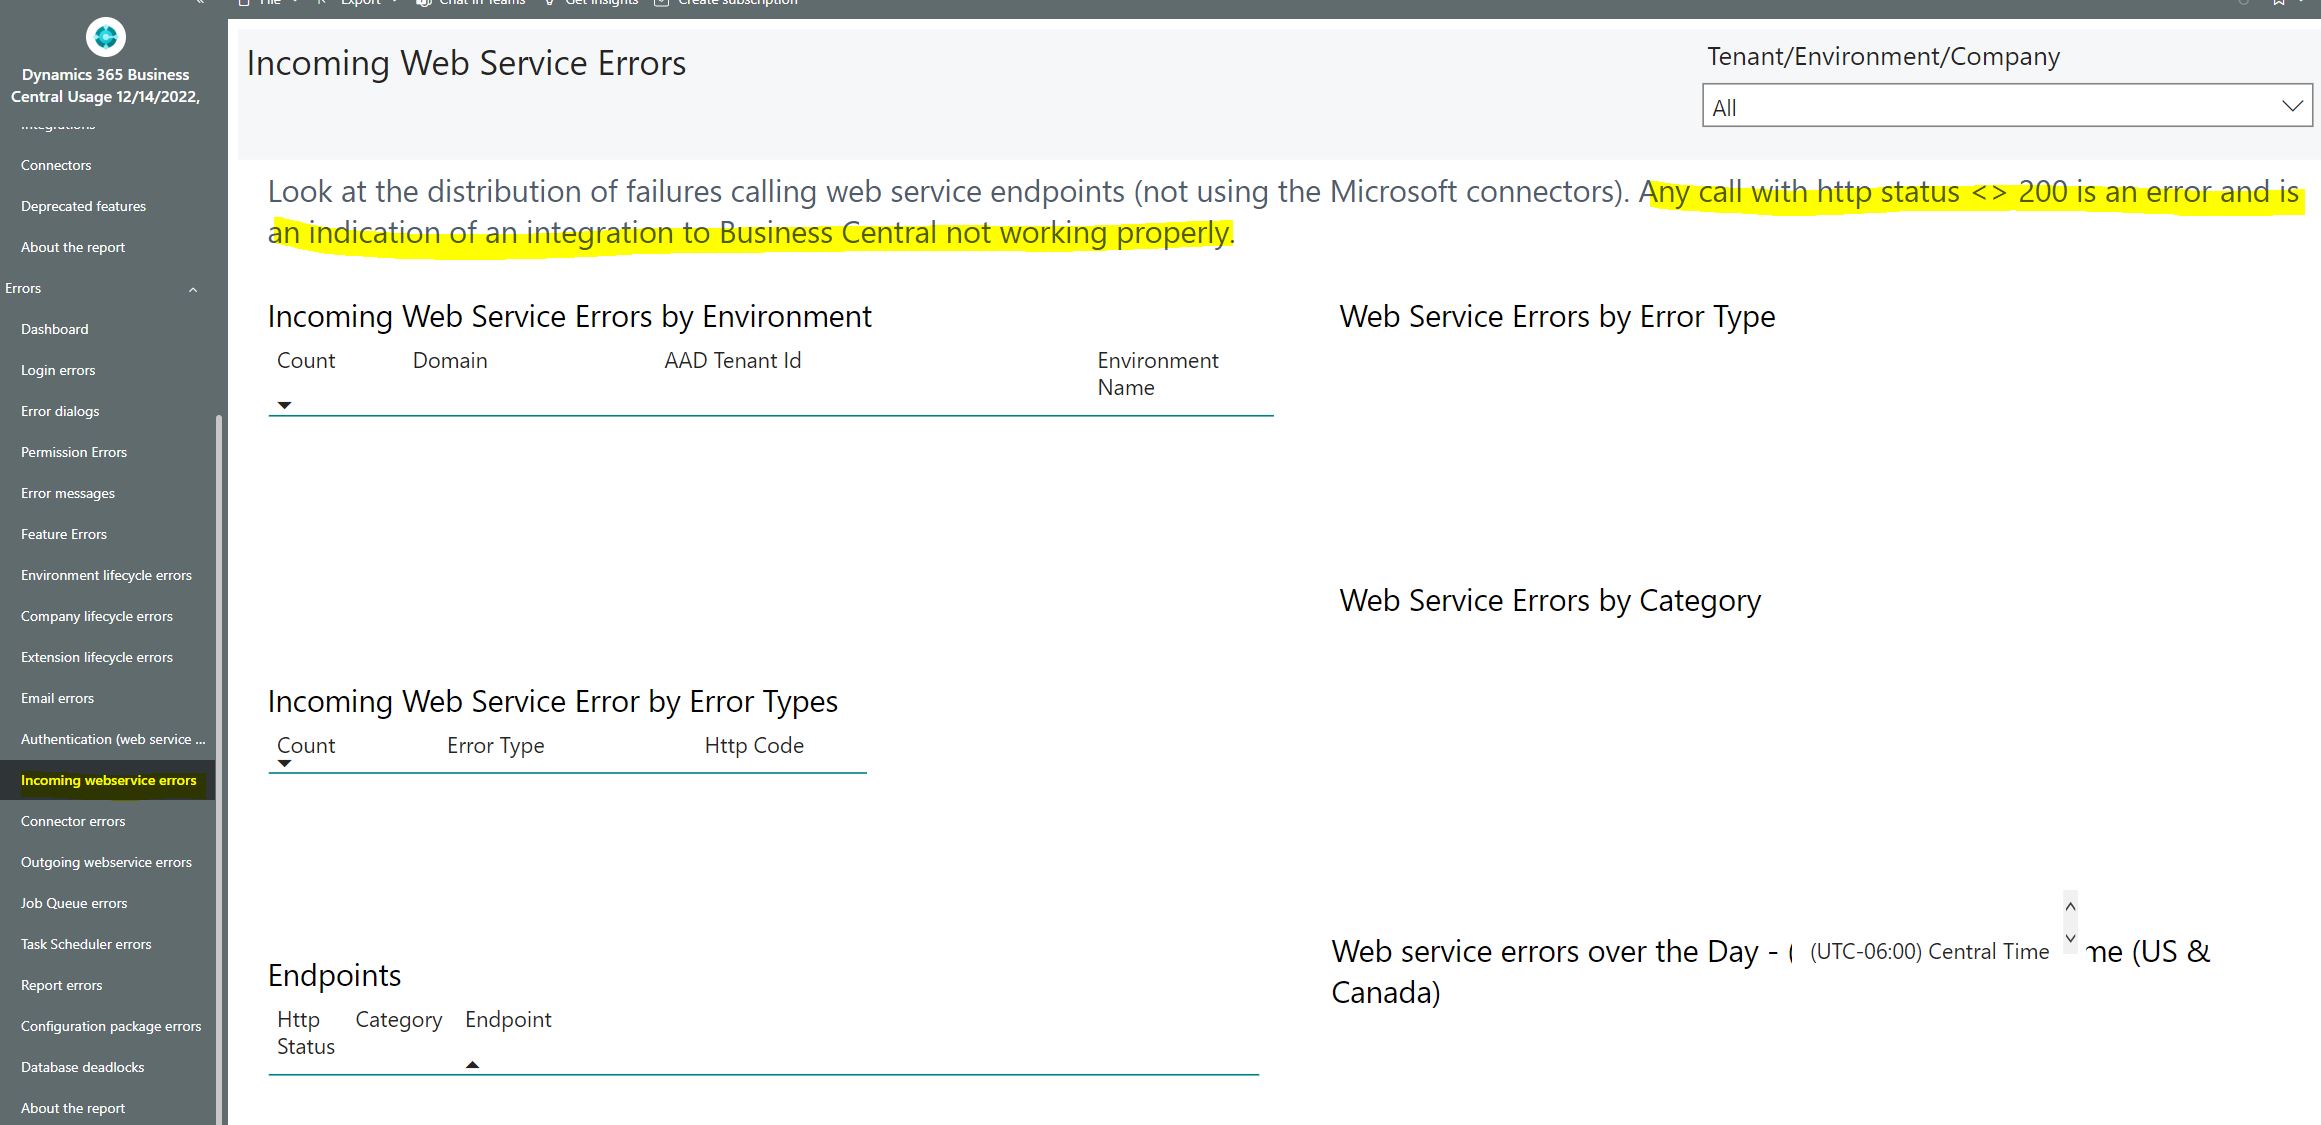
For more information check the awesome documentation and the sample KQL on incoming web services error logs.
Example 4: App updates
Under Performance, there is a section App Updates.

The statistics related to updates are important for planning releases or scheduled planned upgrades,
Extension Details section offers the snapshot of all installed extensions and their version.
Other Performance metrics:
- PageViews: gives average load time in seconds for top n pages
- Reports: min, max and average time for running reports
- Long running SQL queries
- Database lock timeouts
- Long running AL methods: showing in which object and extension the long method was called from as well as the call stack.
Sharing the App
- To share the Power BI workspace with other persons, go to Workspaces -> Choose the workspace for you newly installed Power BI app -> On the right side click Access -> Add the email of the person. This will make the app appear under Workspaces in their Power BI portal.

2. Provide the url to the person and ask them to open it in a browser. This will make the app appear under Apps in their Power BI portal
Azure Monitor Costs
There is a cost associated with having the Application Insights service running in your Azure tenant.
The cost depends on 2 important components:
- data ingestion
- data retention
With a Pay as you go account you get 5 GB of data ingested included.
The default for data retention is 90 days.
In your Azure portal, under your Application Insights service you can setup thresholds for when the data ingested reaches certain levels. You can also enable warning when the data ingested approaches the limit.
There is also an estimator tool in Azure which you can interact with: https://azure.microsoft.com/en-us/pricing/calculator/?service=monitor
You can also read Stefano Demilliani post here in regard to costs of running Aplication Insights.
And, of course, the Microsoft document on Azure Monitor costs.
Final words
We witnessed in the last 2 blog posts the benefits of Business Central emitting telemetry data for various activities and operations on environments and apps/extensions. Monitoring telemetry gives you a look at the activities and general health of your environments/apps, so you can diagnose problems and analyze operations that affect performance.
The Power BI app gives insights of what is happening in the environment, but if you want to target telemetry emitted by ISV apps, you can use a similar template Microsoft released under Power BI App Usage,
The app can be downloaded from here and has the same look and feel as the Business Central Usage.

Both apps are free and open source, however a Power BI Pro license is needed past trial period of 60 days.
The Power BI app is a template app that can be adjusted but more analysis is needed for cases where changes in the app will require merging with a new template version of the app.
Looking forward to the new changes coming in the future. For more info and updates check Github project.


4 Responses
Nice post! Like the sharing of power BI app. I generally publish them so colleagues can search for them.
A minor detail is at this time telemetry for bc is still “new”. By that I mean that the a bunch of these functions won’t work if you run older bc on-prem versions plus that some telemetry events doesn’t work at all for on-prem. Check ms docs for active telemetry events for each bc version and cloud VS on-prem
Hey, I have deployed the Azure Insights, and connected the Azure Insights to the Power BI App. I have flipped through each of the Power BI Pages, but there only seems to be data and insights on the Performance>Reports Page…. and most if not all pages everywhere else in the Power BI Report appear empty or “Does Not enough Data to run analysis”. Any pointers?
did you try to refresh your data? try querying yourapp insight service in azure. if there is data tgen you pergaps need to pull it again in power bi app.